Currency markets are usually boring. Rates move by fractions of a percent, traders sip coffee, and nothing makes the evening news.
Then, every few years, something truly wild happens.
Here are some of the most dramatic, funny, and painful currency moments in recent history — and what a currency strength index would have revealed to anyone watching.
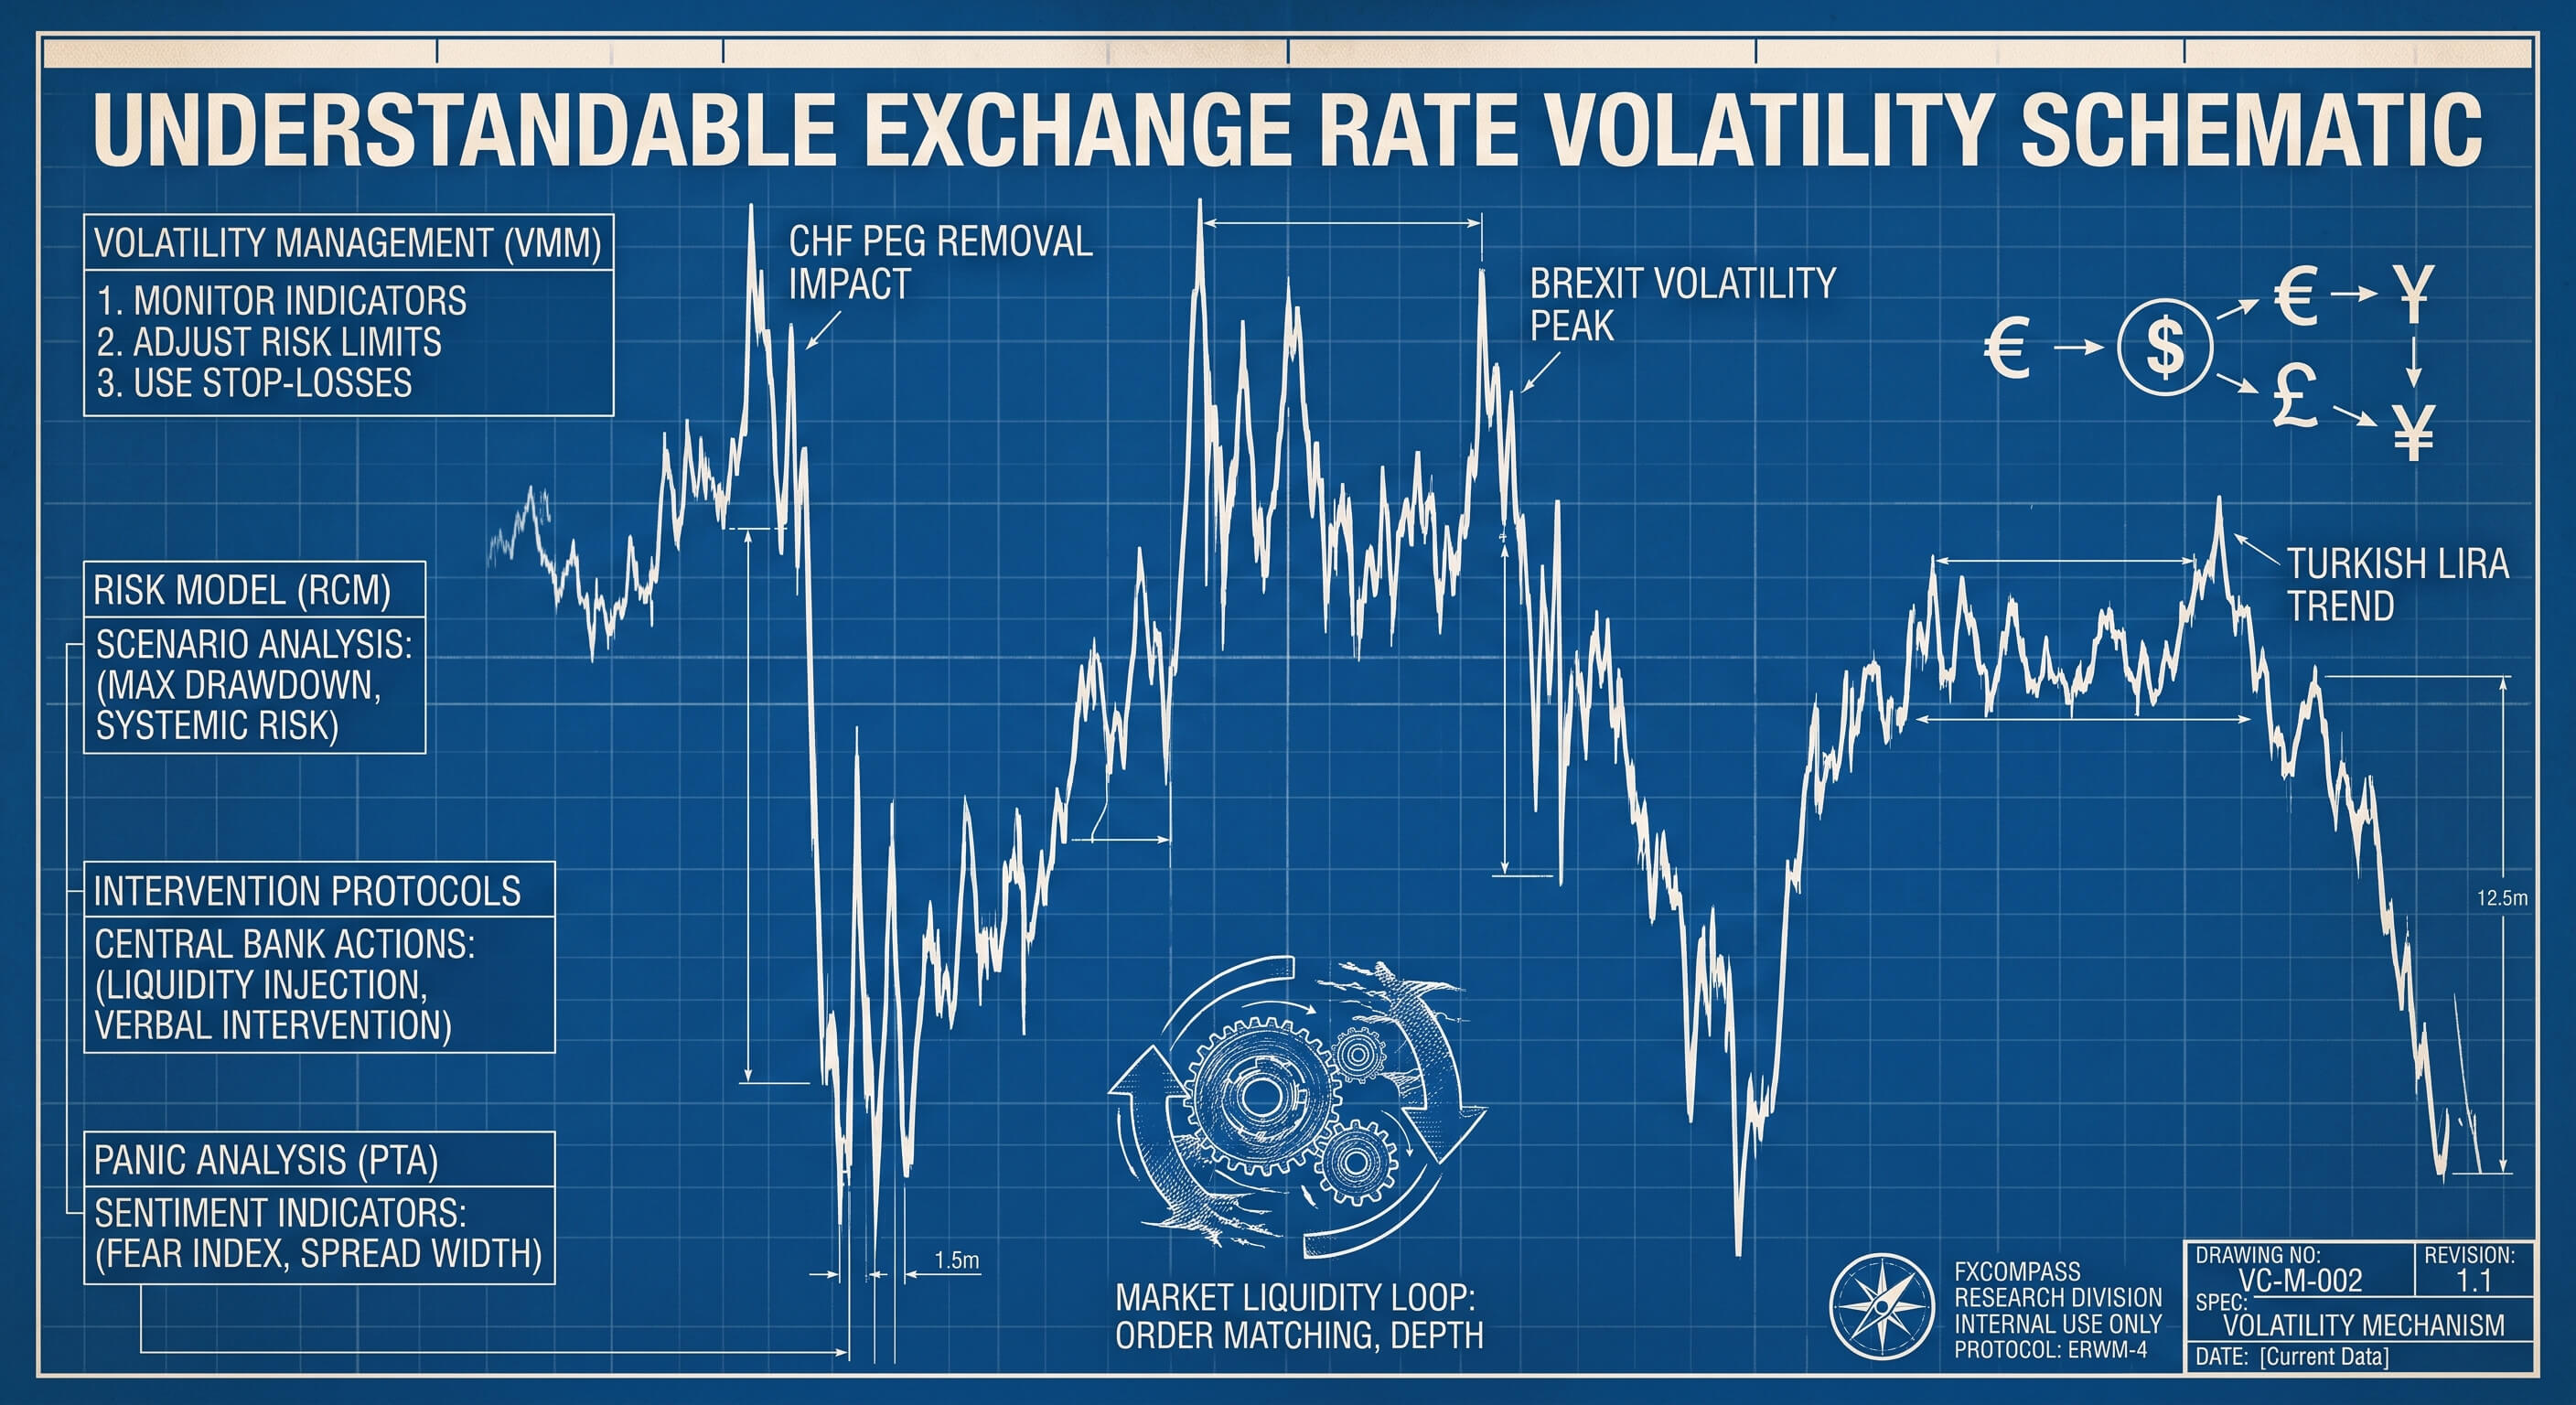
The Swiss Franc earthquake (January 2015)
For years, the Swiss National Bank (SNB) kept the EUR/CHF exchange rate pegged at 1.20. Traders treated it as a guarantee. Some even built leveraged bets on it.
On January 15, 2015, the SNB suddenly removed the peg.
The Swiss Franc surged 30% against the Euro in minutes. Some brokers went bankrupt. Forex traders lost their life savings. The entire Swiss export industry collectively gasped.
What the strength index showed: CHF went from "stable, slightly weak" to "the strongest currency on the planet" in a single afternoon. The spike was visible against every currency in the basket — not just EUR. Anyone monitoring a strength index would have seen CHF was already quietly strengthening for weeks before the shock, as markets sensed the peg was unsustainable.
The British Pound flash crash (October 2016)
At 7:07 AM Tokyo time on October 7, 2016, the British Pound dropped 6% in two minutes. It went from $1.26 to $1.18 and then mostly recovered within hours.
The cause? Nobody is entirely sure. Some blamed algorithmic trading gone haywire. Others pointed to a fat-finger trade. The Bank of England investigated and concluded it was a perfect storm of thin liquidity and automated selling.
What the strength index showed: GBP was already the weakest major currency in the basket following the Brexit vote four months earlier. The flash crash was dramatic, but the strength index had been screaming "weak Pound" since June 2016. The crash was a symptom, not the disease.
Turkey's Lira: a slow-motion disaster
The Turkish Lira didn't collapse in one day — it melted over years. In 2015, 1 USD bought about 2.7 TRY. By 2023, the same dollar bought 27 TRY. That's a 90% loss of value.
The causes were a mix of unconventional monetary policy (cutting interest rates during high inflation), political interference with the central bank, and eroding investor confidence.
What the strength index showed: The Lira was consistently the weakest currency in any basket that included it. While individual pairs fluctuated, the strength index painted an unmistakable picture of broad-based collapse. No matter which currency you compared it to, TRY was losing.
The Turkish Lira story is a reminder: when your government's monetary policy fights market reality, the currency always loses eventually.
The Japanese Yen's long goodbye (2021-2024)
The Yen's decline was gradual but stunning. In January 2021, 1 USD bought about 103 JPY. By mid-2024, it took 160 JPY to buy that same dollar — a 35% depreciation.
Japanese tourists suddenly found everything abroad expensive. Foreign tourists in Japan found a wonderland of cheap sushi and affordable hotels.
What the strength index showed: JPY was sinking against everything — not just USD. The strength index showed the Yen in a steady downtrend against EUR, GBP, AUD, and even emerging market currencies. This wasn't a "strong Dollar" story; it was a "weak Yen" story.
The Euro's near-parity scare (2022)
In September 2022, the Euro fell below parity with the US Dollar for the first time in 20 years. EUR/USD hit 0.9536. European travelers to the US suddenly faced a brutal exchange rate.
The cause was the energy crisis following Russia's invasion of Ukraine, combined with aggressive Fed rate hikes.
What the strength index showed: The picture was more nuanced than EUR/USD suggested. The Euro was indeed weak against the Dollar, but it was strengthening against several other currencies — the Yen, the Swedish Krona, and several Central European currencies. The strength index showed EUR as "moderately weak" rather than "in freefall," which is exactly what the broader picture warranted.
What can we learn?
These events share a common thread: looking at a single exchange rate gave an incomplete — and sometimes dangerously wrong — picture.
- The Swiss Franc shock was visible in the strength index weeks before the peg broke
- The Pound's flash crash was just noise on top of an already-visible weakness
- The Lira's collapse was unmistakable in the strength index long before it made headlines
- The Yen's decline was a broad-based phenomenon, not just a USD story
- The Euro's "collapse" in 2022 was really a moderate weakness — the Dollar was just exceptionally strong
Want to see how your favorite currencies are performing right now? Check the live strength index on FX Compass — it updates daily with data from the ECB.
Explore these currencies live
Want to see how these currencies are performing right now? Open the dashboard with the relevant currencies pre-selected:
- CHF, EUR, GBP & USD — 6-year view covering the Swiss Franc shock era
- GBP, EUR & USD — 3-year trend to see how the Pound has recovered
- JPY vs USD & EUR — 3-year view following the Yen's long decline
- Major currencies — 1-year snapshot for the current picture
The takeaway
Currency markets can be wild, funny, and terrifying. But you don't have to be caught off guard. A strength index gives you the big picture — the kind of view that central bankers and institutional traders have always used, now available to everyone.
The next time someone tells you "the Euro is crashing," check the strength index first. You might be surprised by what you find.