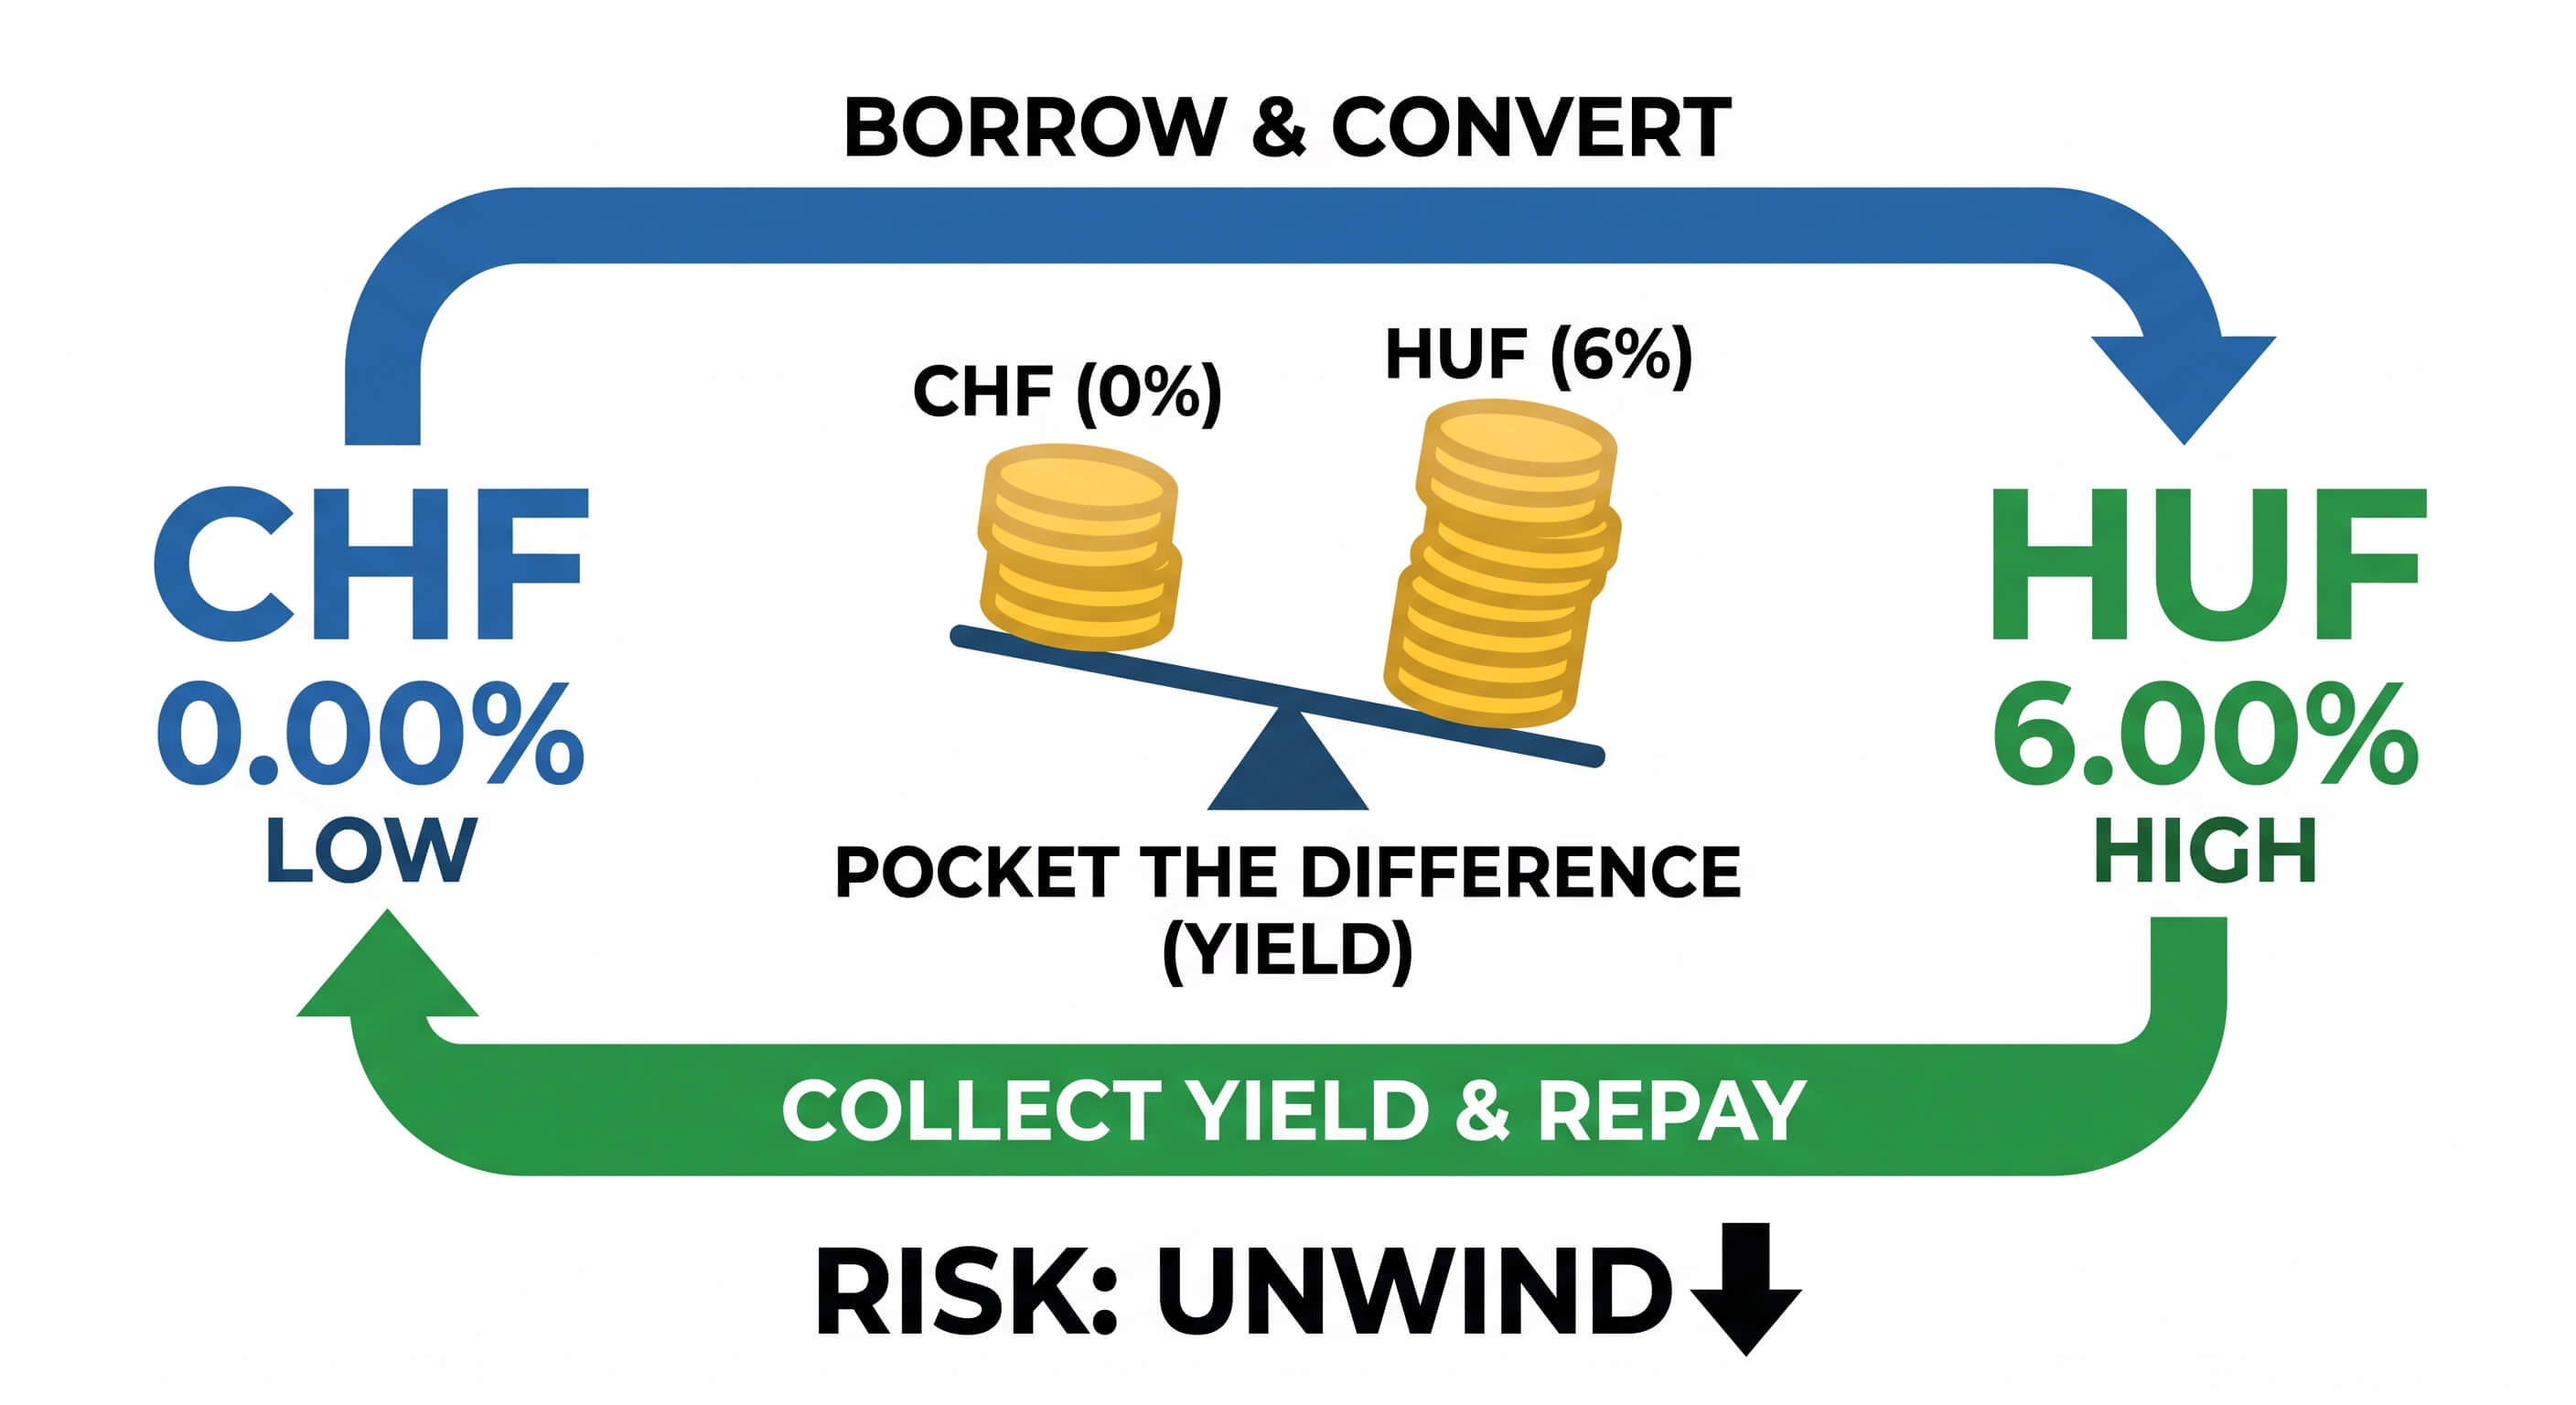
Every year, a chunk of the biggest moves on a currency strength chart traces back to one simple trade: borrow money where it's cheap, and invest it where it pays more. It's called the carry trade, and it's one of the most reliable - and most dangerous - patterns in currency markets.
The mechanic, in one sentence
A trader borrows in a currency with a low interest rate, converts the proceeds into a currency with a high interest rate, and pockets the difference - as long as the exchange rate doesn't move against them first.
That last clause is the whole story. The interest rate gap is predictable. The exchange rate isn't. When the funding currency starts rising instead of falling, carry trades lose money fast, and everyone tends to unwind at the same time.
The 2026 rate map
Here's where the major central bank rates stood as of July 2026 - the raw material every carry trade is built from:
| Currency | Central bank | Policy rate |
|---|---|---|
| Swiss Franc (CHF) | SNB | 0.00% |
| Japanese Yen (JPY) | BOJ | 0.75% |
| Euro (EUR) | ECB | 2.25% |
| US Dollar (USD) | Federal Reserve | 3.50-3.75% |
| Australian Dollar (AUD) | RBA | 4.35% |
| Hungarian Forint (HUF) | MNB | 6.00% |
Rates change every few weeks. Check the latest central bank decisions before assuming any of these figures still hold - what matters for a carry trade is the gap between two rates, not the absolute level.
The classic setup borrows in franc or yen - near-zero rates for over a decade - and invests in forint or Aussie dollar, where holding the currency alone pays 4-6% a year before any price appreciation.
Why this shows up on a strength chart
A currency held for its yield tends to attract steady buying, which shows up as a slow, grinding uptrend rather than a sharp spike. That's exactly the pattern behind the forint's run in the 2026 currency strength ranking: a central bank holding rates well above the euro area's pulled in carry flows and pushed the forint to the top of the 16-currency basket.
The mirror image is the yen. A currency that funds carry trades gets sold, not bought, which is a big part of why the yen has stayed near the bottom of the ranking for years - even as the Bank of Japan has started, slowly, to close the gap.
The risk: when the funding currency turns
Carry trades don't fail gradually. They fail all at once, because everyone holding the same trade tends to exit through the same door.
The clearest recent example is the yen. Years of near-zero Japanese rates funded carry trades into dollars, forint, and other higher-yielding currencies. When the Bank of Japan started raising rates while other central banks paused or cut, the interest rate gap narrowed, the yen firmed up, and traders who'd borrowed yen had to buy it back at a worse rate than they'd sold it - all at once, in August 2024's sharp, brief unwind.
The same setup is quietly rebuilding today. The BOJ raised its policy rate again in June 2026, and the ECB hiked for the first time since 2023 that same month - both funding currencies inching upward while the Fed holds steady. Every basis point that narrows a rate gap makes the trade a little more crowded and a little more fragile.
None of this is a signal to buy or short anything - it's a lens for understanding why certain currencies trend the way they do. Treat it as context, not a trading strategy.
How to watch it on FX Compass
- Pick a funding/target pair. Start with a low-rate currency (CHF, JPY) and a high-rate one (HUF, AUD, or USD relative to CHF/JPY).
- Open the dashboard and select both currencies alongside the full basket.
- Watch for a slow, steady divergence. That grind - not a sudden jump - is the signature of yield-seeking flow.
- Watch for the divergence flattening or reversing. That's the early sign a rate gap is narrowing and the trade is losing its edge, well before it shows up in the headlines.
Compare pairs directly with EUR vs USD or USD vs JPY to see the rate-gap story play out in a single line.
The bottom line
The carry trade is simple in theory - pocket the rate gap - and messy in practice, because it depends on an exchange rate staying calm long enough to collect it. Rate gaps show up first as slow trends on a strength index, long before they make headlines, and they can unwind just as fast as they built. Watching the gap, not just the currencies, is the difference between understanding the move and getting caught by it.
This article is for informational purposes only and is not investment advice.